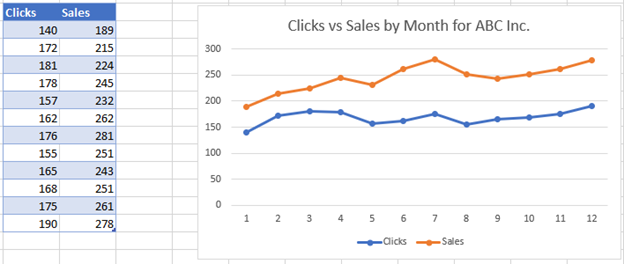
To create a double line graph in Google Sheets, input your data into two separate columns, then select them and go to Insert > Chart > Line Chart to plot the graph. By customizing the chart options, you can label the axes and add a title to make your double line graph visually appealing and informative.
Creating a line graph with multiple lines in Google Sheets is a fundamental way to showcase various data sets in a visually comprehensible manner. Through simple steps, you can effectively illustrate trends, comparisons, and correlations between two or more categories of information.
This guide aims to provide a clear and concise process for making a double line graph in Google Sheets, ensuring that your data is presented effectively and professionally. Mastering this skill will empower you to convey complex data with ease and precision.
Credit: m.youtube.com
Making A Double Line Graph In Google Sheets
Making a Double Line Graph in Google Sheets involves creating a visual representation of data points with two lines to compare trends effectively.
Using Google Sheets
To begin, open Google Sheets and input your data into the spreadsheet. Select the data points you want to include in the double line graph.
Customizing The Table
You can customize the appearance of your table by changing colors, fonts, and other formatting options to make your data more visually appealing.
Changing Chart Title
To change the chart title, click on the chart and then select “Chart editor” from the toolbar. Here, you can edit the title to reflect the purpose of your graph.
Labeling Horizontal And Vertical Axes
Label the horizontal and vertical axes by clicking on the chart and selecting “Chart editor.” From there, you can add axis titles to provide context for your data.
Adding A Legend
To add a legend to your double line graph, navigate to the “Chart editor” and enable the legend option. This will help viewers understand the different lines on the graph.
Copying Graph To Google Doc
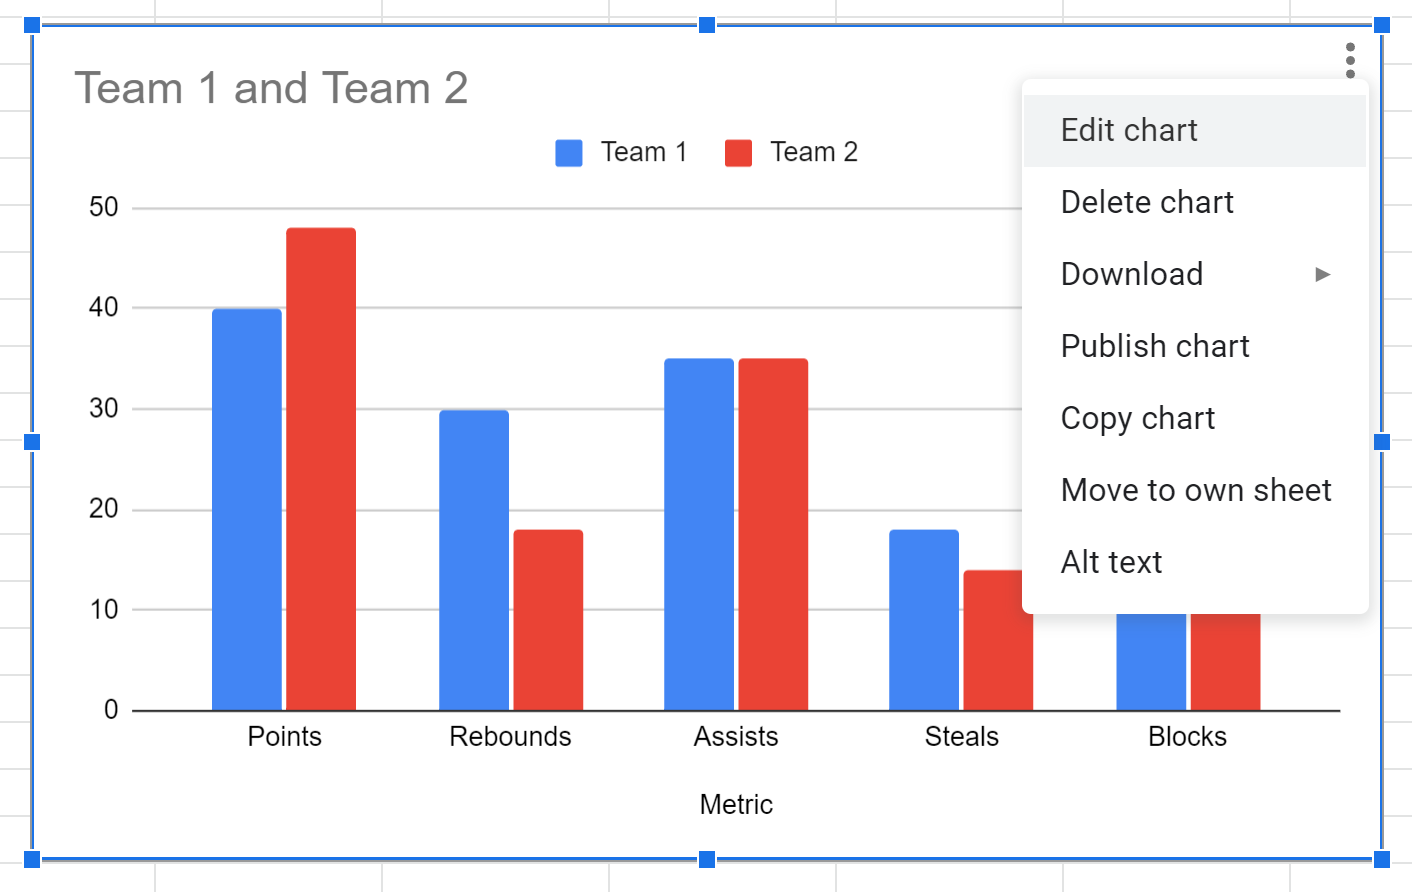
Once your double line graph is ready, you can copy it by right-clicking on the chart and selecting “Copy.” This will allow you to paste the graph into a Google Doc for further use.
Inserting Graph Into Google Doc
To insert the copied double line graph into a Google Doc, open the document and paste the graph in the desired location. This ensures your data visualization is seamlessly integrated into your document.
Credit: www.automateexcel.com
Creating A Line Graph With Multiple Lines
Google Sheets is a powerful tool for creating various types of charts, including line graphs with multiple lines. It provides a user-friendly interface that allows you to input data, customize the chart, label the axes, and edit the graph effortlessly.
When creating a line graph with multiple lines in Google Sheets, the first step is to enter your data into the spreadsheet. You can input your data into separate columns for each line you want to include in the graph. Simply click on a cell and start typing to enter your data.
After entering your data, you can customize the line graph to suit your preferences. Google Sheets offers various customization options such as changing the color, style, and thickness of the lines, as well as adding data labels and a chart title to enhance the visual appeal of the graph.
Properly labeling the axes is crucial for making your line graph easy to understand. You can label the horizontal and vertical axes to provide context for the data being presented, making it easier for viewers to interpret the information depicted in the graph.
If you need to make adjustments to your line graph, Google Sheets allows for easy editing. You can modify the data, customize the chart style, or add or remove data series as needed, ensuring that your graph accurately represents the information you want to convey.
Once your line graph with multiple lines is ready, you can insert it into your document or presentation directly from Google Sheets. This seamless integration makes it convenient to share your chart with others or include it in reports, slideshows, and other materials.
Making A Dual Axis Line Chart In Google Sheets
Introductory paragraph about ‘Making a Dual Axis Line Chart in Google Sheets’Creating a dual axis line chart in Google Sheets can provide valuable insights by allowing you to visualize two different data sets on the same graph. This powerful visualization tool enables you to compare trends, patterns, and relationships between two variables simultaneously. In this article, we will explore the step-by-step process of making a dual axis line chart in Google Sheets. From data requirements to customizing the chart, you will learn how to create and optimize a dual axis line chart to effectively communicate your data.
Data Requirements For Dual Axis Line Chart
Constructing Data for Dual Axis Line ChartConstructing Data For Dual Axis Line Chart
Creating a Dual Axis Line ChartCreating A Dual Axis Line Chart
Customizing the Dual Axis Line ChartCustomizing The Dual Axis Line Chart
Exporting the Dual Axis Line ChartExporting The Dual Axis Line Chart
Adding Multiple Lines To A Google Sheets Chart
To create a double line graph in Google Sheets, you can easily add multiple lines to your chart. Simply click on the chart, then select the “Add series” button in the “Chart editor” sidebar. This allows you to compare different data sets and create a visually informative graph.
Using Google Sheets
In Google Sheets, you can create informative double line graphs to visualize your data. Adding multiple lines to a chart allows for easy comparison and analysis of different datasets.
Adding A New Line
To add a new line to your Google Sheets chart, follow these simple steps:
- Click on the existing chart in your Google Sheets document.
- Access the “Chart editor” sidebar.
- Click on the “Add series” button.
Adding multiple lines to your Google Sheets chart provides a clear way to show various data points and trends. Utilize this feature to enhance the visual representation of your information.
Credit: scales.arabpsychology.com
Frequently Asked Questions Of How To Make A Double Line Graph In Google Sheets
How Do You Make A Line Graph With Two Lines In Google Sheets?
To create a line graph with two lines in Google Sheets, click on the chart and select “Chart editor. ” In the sidebar, click on the “Add series” button to add a new line. This allows you to compare different sets of data.
Customize the graph by labeling the axes and adding a title.
How Do You Make A Double Graph On Google Sheets?
To make a double graph on Google Sheets, click on the chart, then select “Add series” in the Chart editor sidebar.
How To Make A Double Line In Google Sheets?
To make a double line in Google Sheets, insert a chart and click on “Add series” in the “Chart editor” sidebar.
How Do You Make A Double Line Graph?
To make a double line graph in Google Sheets, first insert a chart and customize the table. Label the axes, add a legend, and then copy or insert the graph into your Google Doc. You can also add multiple lines to compare different sets of data by using the “Add series” button in the “Chart editor” sidebar.
Conclusion
Looking to enhance your data visualization skills? Now you can easily create double line graphs in Google Sheets. With simple steps like customizing axes and adding legends, your charts will be clear and informative. Start making impactful graphs today!


